
Trace: A Taxonomy-Guided Environment for Multidomain Visual Reasoning
Trace is a procedural environment for broad, exactly verifiable visual reasoning. It separates scene grammar, executable task program, and bounded query variation so that visual realization and reasoning structure can vary independently while preserving exact supervision. Every instance includes a rendered image, prompt, typed answer, verifier state, and replayable execution trace.
Training Qwen2.5-VL-3B and 7B on 64,000 Trace instances improved the macro-average across 24 external benchmarks by +3.51 and +4.06 percentage points, respectively. See the transfer results.
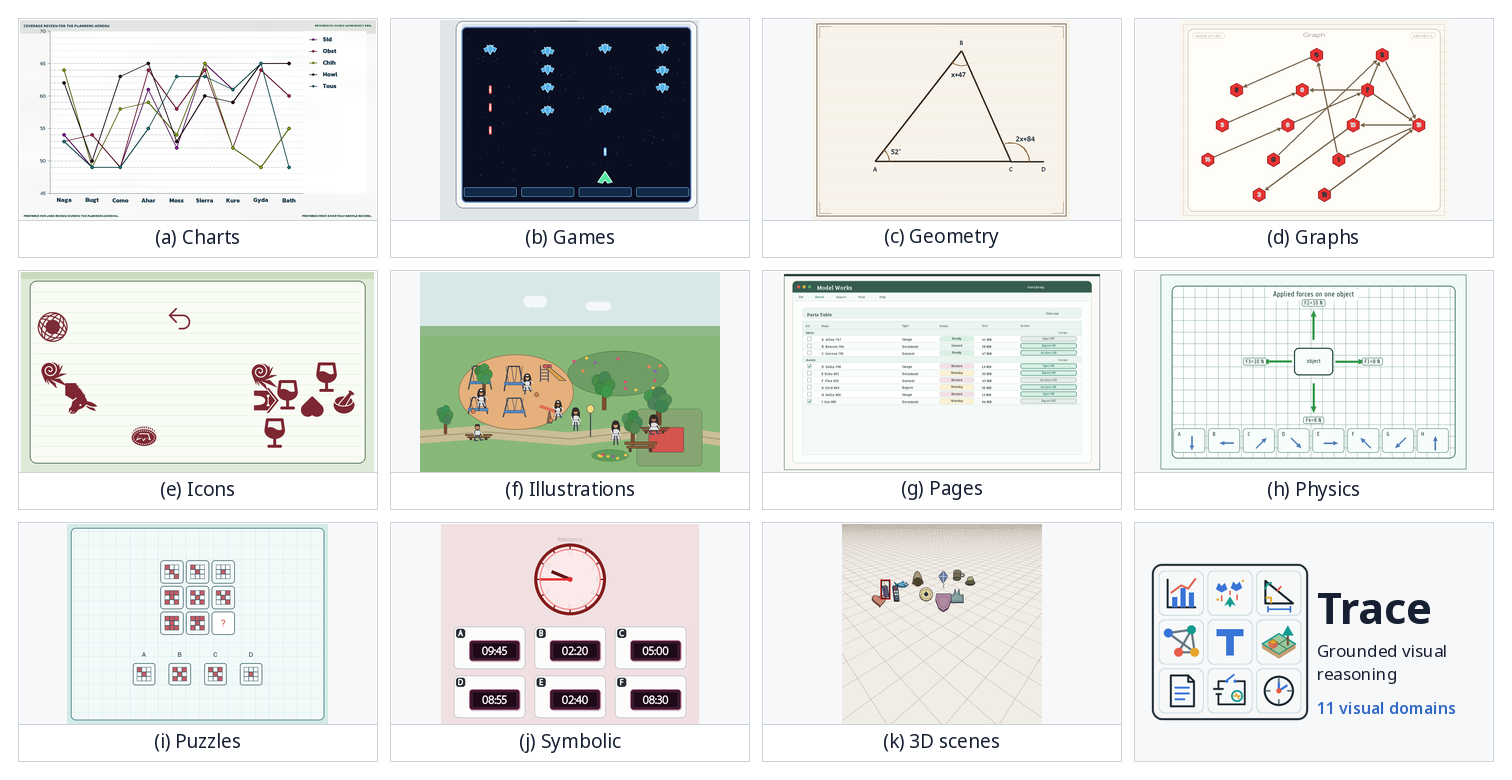
Try Trace
Trace is for researchers and engineers building verifiable VLM post-training, synthetic-data, and evaluation pipelines.
Explore all 1,000 tasks in the browser, including their deterministic images, prompts, typed supervision, reward contracts, annotation overlays, and public execution traces. Or generate the default example locally from the exact revision used by the demo:
python -m pip install \
  "trace-tasks @ git+https://github.com/maveryn/trace.git@bb7fdd1fc8a0f8a2e3db7efe910a14e81d58feb7"
from trace_tasks import generate_task

sample = generate_task(
    "task_geometry__graph_paper__polygon_area_value",
    seed=42,
    max_attempts=100,
)
sample.image.save("trace-example.png")
print(sample.prompt)
print(sample.answer_gt.to_dict())
print(sample.annotation_gt.to_dict())
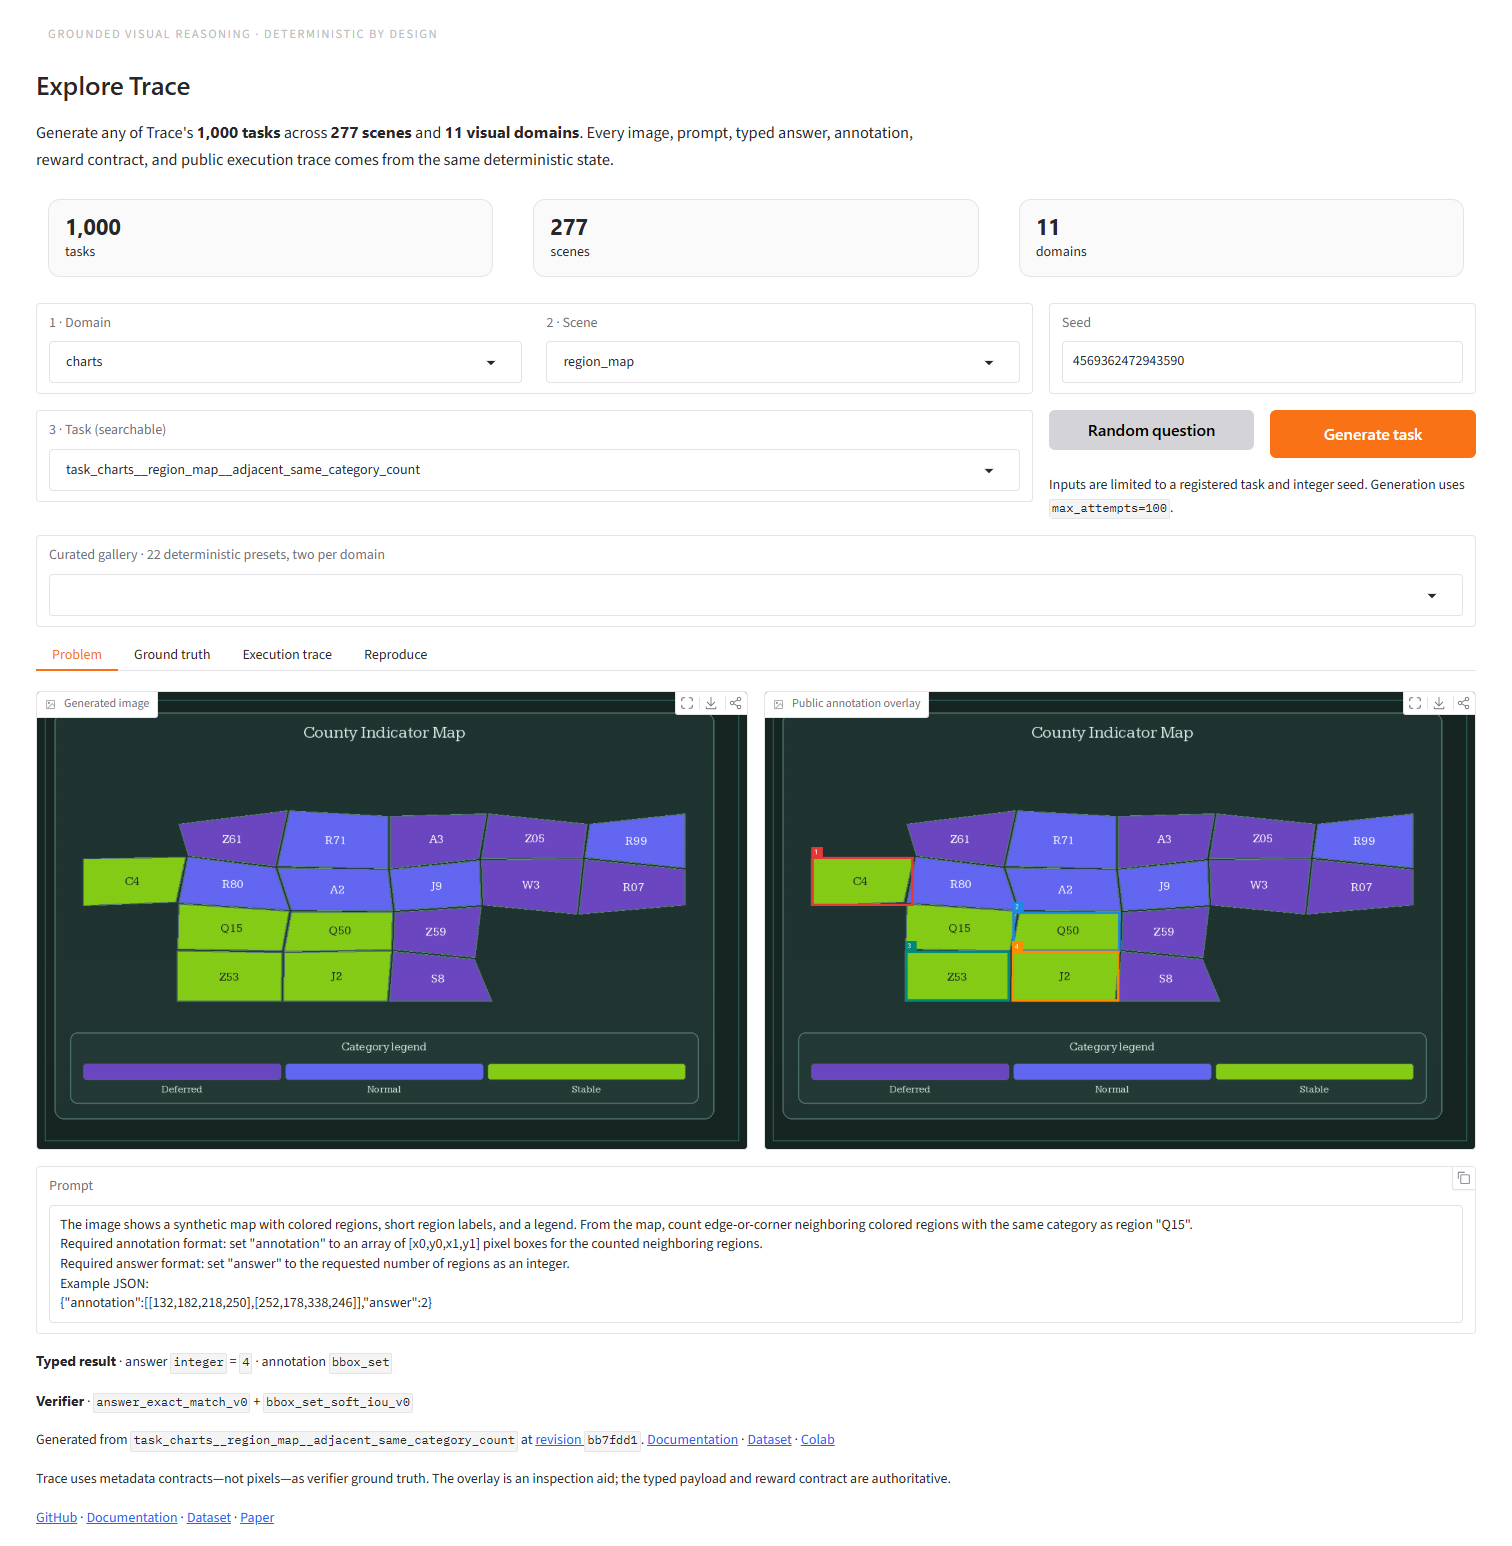
How Trace works
Trace organizes visual reasoning as domain → scene grammar → task program.
A deterministic seed instantiates semantic scene state, and the selected task
program executes over that state to derive a unique typed answer and verifier
state. The image and prompt are then rendered from the same underlying state.
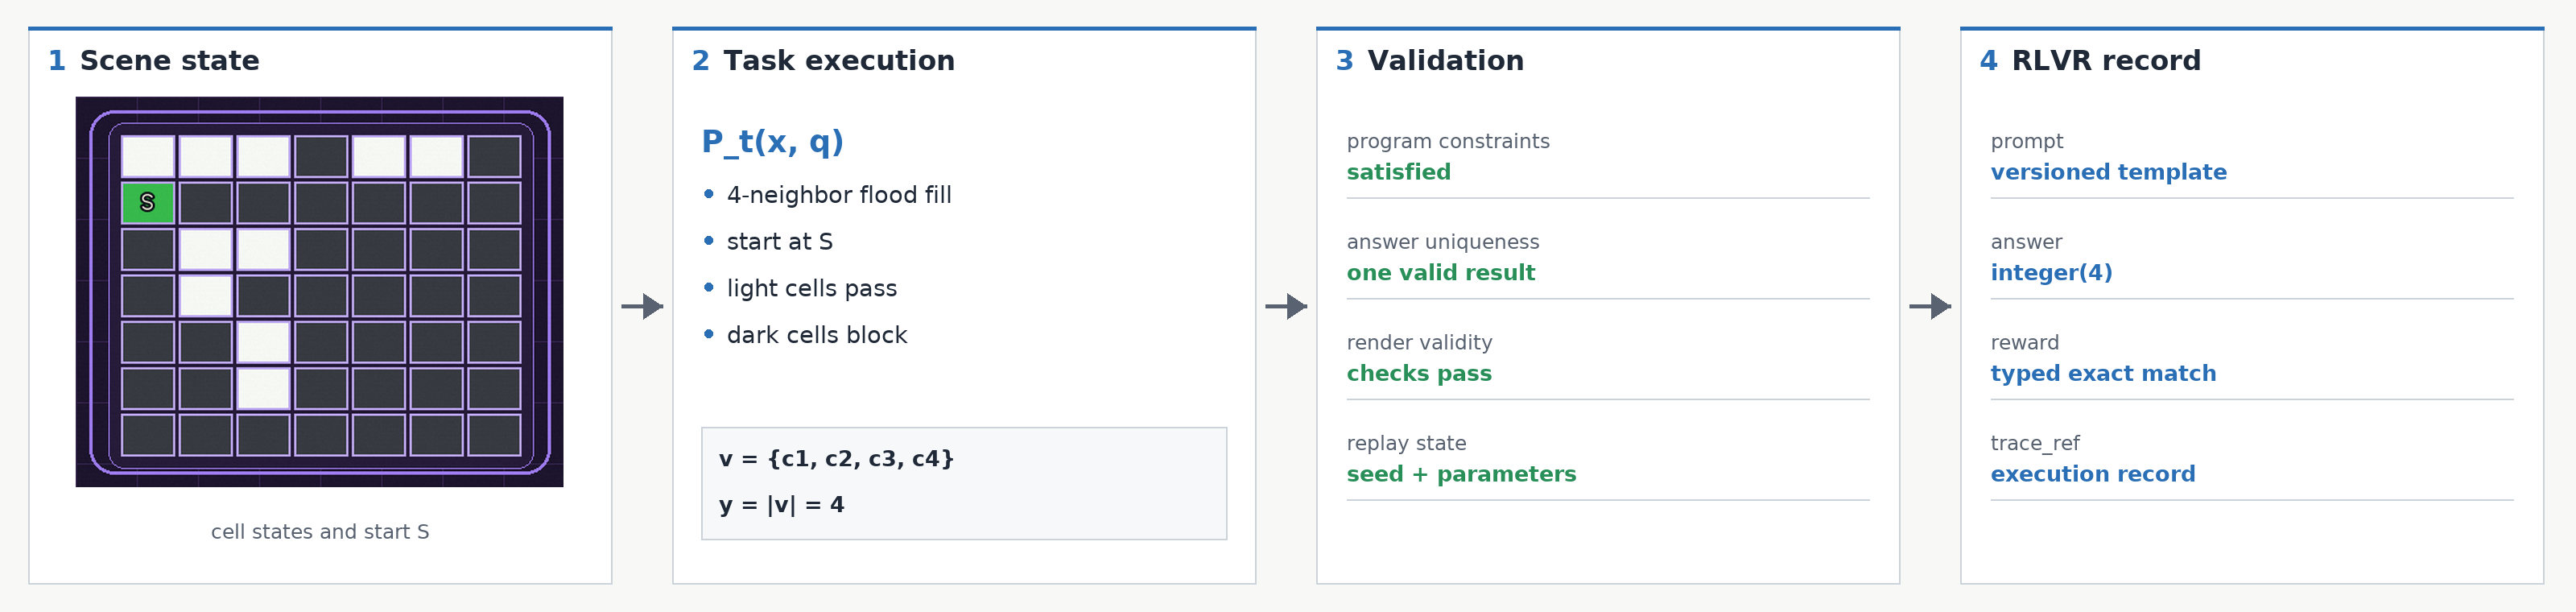
This shared-state design keeps generation, supervision, and verification aligned. Each finalized record contains the rendered problem, exact scoring contract, image-space annotation, and an execution-trace reference for inspection and replay.
External benchmark transfer
Qwen2.5-VL models trained on 64,000 Trace instances improve the macro-average across 24 external benchmarks at both evaluated model scales. Values are mean ± sample standard deviation across decoding seeds 42, 43, and 44; paired deltas compare matched seeds.
On 2,000 unseen TRACE instances, accuracy improves from 24.45 to 41.05 at 3B and from 34.25 to 51.55 at 7B.
Base versus TRACE by benchmark
The table reports all 24 external benchmarks for the matched 3B and 7B comparisons. Parenthesized values are mean seed-paired TRACE-minus-Base changes in percentage points.
View all 24 benchmark results
| Benchmark | 3B Base | 3B TRACE (Δ) | 7B Base | 7B TRACE (Δ) |
|---|---|---|---|---|
| Charts & Tables | ||||
| ChartQAPro | 31.57 ± 0.66 | 31.43 ± 1.33 (-0.14) | 45.81 ± 0.24 | 48.05 ± 0.40 (+2.24) |
| CharXivReason | 28.90 ± 1.11 | 34.67 ± 1.47 (+5.77) | 39.73 ± 1.17 | 47.13 ± 0.35 (+7.40) |
| TableVQABench | 69.27 ± 0.91 | 71.99 ± 0.28 (+2.72) | 75.20 ± 0.90 | 78.31 ± 0.17 (+3.11) |
| EvoChart | 48.51 ± 0.45 | 46.83 ± 1.36 (-1.68) | 57.07 ± 0.72 | 64.91 ± 0.05 (+7.84) |
| Visual Math | ||||
| MathVision | 19.25 ± 0.65 | 25.35 ± 0.86 (+6.10) | 24.81 ± 0.75 | 27.42 ± 0.62 (+2.61) |
| MathVista | 58.13 ± 3.74 | 64.43 ± 2.12 (+6.30) | 68.67 ± 0.40 | 73.37 ± 0.45 (+4.70) |
| MathVerse | 33.59 ± 1.95 | 40.02 ± 1.52 (+6.43) | 43.44 ± 0.92 | 47.76 ± 0.51 (+4.31) |
| WeMath | 17.87 ± 1.24 | 28.82 ± 0.40 (+10.95) | 35.20 ± 2.92 | 46.16 ± 1.32 (+10.96) |
| Science & General | ||||
| PhyX mini MC | 32.80 ± 9.96 | 37.47 ± 5.58 (+4.67) | 40.97 ± 3.57 | 48.70 ± 0.82 (+7.73) |
| MMMU-ProVis | 26.59 ± 0.32 | 31.16 ± 1.20 (+4.57) | 35.70 ± 0.39 | 39.36 ± 0.71 (+3.66) |
| RealWorldQA | 60.35 ± 0.42 | 62.14 ± 1.18 (+1.79) | 65.45 ± 0.87 | 68.50 ± 0.68 (+3.05) |
| MMStar | 52.27 ± 0.52 | 55.24 ± 1.02 (+2.98) | 61.89 ± 0.87 | 65.64 ± 0.34 (+3.76) |
| Spatial Reasoning | ||||
| EmbSpatial | 59.07 ± 1.04 | 60.88 ± 1.13 (+1.81) | 69.42 ± 0.90 | 70.95 ± 0.69 (+1.53) |
| SpatialVizBench COT | 30.08 ± 1.22 | 31.84 ± 1.52 (+1.75) | 35.14 ± 0.10 | 35.68 ± 0.34 (+0.54) |
| CV-Bench 3D | 58.67 ± 8.32 | 66.97 ± 3.68 (+8.31) | 76.25 ± 1.96 | 81.00 ± 0.43 (+4.75) |
| ERQA | 35.33 ± 0.80 | 36.42 ± 0.52 (+1.08) | 39.00 ± 1.56 | 41.17 ± 1.28 (+2.17) |
| Perception & Counting | ||||
| BLINK | 44.52 ± 2.10 | 47.13 ± 0.70 (+2.61) | 53.31 ± 1.23 | 56.57 ± 0.73 (+3.26) |
| CountBenchQA | 65.43 ± 1.59 | 68.65 ± 0.83 (+3.22) | 82.14 ± 1.48 | 84.80 ± 1.44 (+2.67) |
| CountQA | 14.88 ± 1.80 | 15.64 ± 0.57 (+0.76) | 19.59 ± 1.17 | 22.51 ± 0.91 (+2.92) |
| TreeBench | 39.26 ± 1.96 | 38.60 ± 1.17 (-0.66) | 38.02 ± 1.37 | 40.25 ± 2.11 (+2.22) |
| Puzzles & Logic | ||||
| PuzzleVQA | 32.55 ± 1.21 | 39.13 ± 1.13 (+6.58) | 44.57 ± 0.64 | 50.02 ± 0.50 (+5.45) |
| VisualPuzzles | 26.20 ± 2.74 | 28.51 ± 0.70 (+2.31) | 31.08 ± 0.15 | 34.02 ± 0.77 (+2.94) |
| LogicVista | 36.47 ± 1.25 | 40.12 ± 1.71 (+3.65) | 42.65 ± 2.24 | 47.35 ± 0.68 (+4.70) |
| MME-Reasoning | 22.62 ± 1.81 | 25.06 ± 1.53 (+2.44) | 25.17 ± 1.18 | 28.03 ± 0.89 (+2.86) |
The research page includes the full eight-model comparison and links to the evaluation artifacts.
Released models
The Trace collection groups the interactive Space, dataset, checkpoints, paper, and evaluation artifacts in one place.
| Released checkpoint | Base model |
|---|---|
| TRACE Qwen2.5-VL-3B | Qwen2.5-VL-3B-Instruct |
| TRACE Qwen2.5-VL-7B | Qwen2.5-VL-7B-Instruct |
See the 3B model card or 7B model card for pinned Transformers inference.
Reproduce
Follow the paper-results reproduction guide for training, evaluation, progress reporting, and validation.
Explore the documentation
Get started
Install Trace, inspect the registry, generate a small dataset, and export examples for RLVR.
Understand the system
Follow generation from taxonomy and task registration through validation, finalization, and export.
Browse the catalog
Explore all 1,000 task contracts by domain, scene, answer type, and reasoning operation.
Contribute
Use the public engineering, testing, documentation, and review workflows.
For complete examples and maintenance interfaces, see the runnable Python examples and repository maintenance and release scripts.
Citation and acknowledgements
Use CITATION.cff
for repository citation metadata and paper.pdf
for the manuscript. The released checkpoints build on
Qwen2.5-VL
and EasyR1. External evaluator and dataset
integration builds on VLMEvalKit,
and bundled resource attributions are listed in
THIRD_PARTY_NOTICES.md.